Police departments and emergency responders have a tough job. Protecting the public while maintaining the trust of citizens in diverse communities would be challenging under any circumstances, and resource constraints all too often add to the burden. In the interest of transparency, police departments around the country are making much of their data publicly available online. Of the many potential uses for this data, perhaps one of the most valuable is its potential to assist police departments in maximizing the effective use of limited budgets.
To investigate this possibility, I worked with a small team to explore a dataset of 911 calls in the city of Seattle, which is available from the Seattle Police Department. The data cover all police responses to 911 calls and span the period from 2010 to early October 2016. We hoped to identify patterns in these calls that could help the police prioritize among incoming calls in real time, and allocate resources to respond as efficiently as possible to the most critical calls. In particular, we wanted to see if we could predict which calls are most likely to be about a violent crime – and thus require an immediate response – based on information about where and when they are placed. We also hoped to see if we could predict which calls are likely to be false alarms.
We had the most success predicting violent versus non-violent events. We designated as violent all calls about crimes the Seattle Police department designated as Assault, Homicide, Armed Robbery, or Drive-by Shooting; they represented almost exactly 4% of the data we analyzed. All other calls were coded as non-violent.
The primary independent variables were the month, day of the week, and time of day that police officers arrived on scene after each call, as well as the police sector from which it came. Absent data on the times of the calls themselves, this was the best we could do to approximate when calls were received, although there may be some bias in the data if the police systematically take longer to arrive after calls in certain areas or in response to certain kinds of events. Due to missing data in earlier years, our analysis focused on 336,253 observations concentrated mainly in 2014-16.
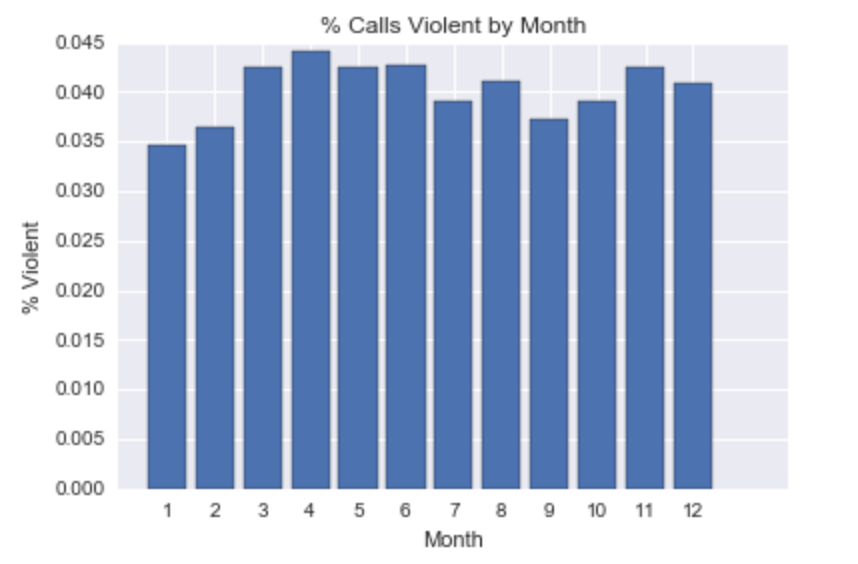
A look at the data reveals a number of interesting patterns, some more surprising than others. Although research shows that violence tends to spike during periods of high heat or rainfall (see this New York Times article for a summary), neither appears to be generally true in Seattle. For example, while November, December, and January are the rainiest months in the city, January sees the least violence of the entire year and December is only the seventh most violent month. Instead, most of the more violent months are in the spring, between March and June, when neither temperature nor rainfall are especially high.
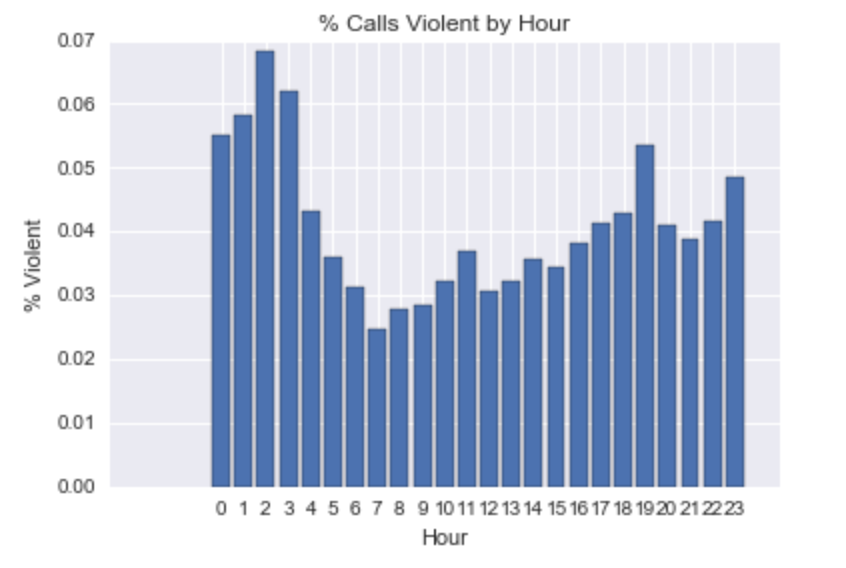
Another striking pattern concerns time of day: violence peaks between 2 and 4 am, and is lowest between 7 and 10 am. The difference here is also substantial: While less than 2.5% of calls between 7 and 8 am concern violent crimes, almost 7% of those between 2 and 3 am do. While it is not surprising that violence is greatest at night, I would not necessarily have anticipated a substantial difference between the late evening (around 9 pm to midnight) and the early morning hours. Yet violent calls are between 1 and 3 percentage points more likely in the hours immediately after midnight than beforehand.
Finally, some of the police sectors are far more likely to be the source of calls about violent crimes than others. A strong majority of the most violent zones are located near downtown and the city center.
We used a variety of classification algorithms to generate binary predictions about whether a given call concerns a violent event, and also to rank calls in order of their chance of being about a violent crime. Such predictions could be used to help 911 operators decide which calls to prioritize during periods of high call volume, and might also assist in ensuring adequate call center staffing during peak periods for violent crime. Although I have not seen hard data about how many 911 calls are not answered (and this surely varies from place to place), I have personally received no answer when I called 911 on at least two occasions in the last two years and suspect that this issue may be relevant for at least some departments. Finally, beyond answering 911 calls, these predictions might also be able to assist the police in deploying their forces around the city.
Of the various algorithms we tested (Logistic regression, K nearest neighbors, Decision trees, Random Forest, and Gradient boosted classification, among others), logistic regression offered the best tradeoff between the accuracy of our predictions, their precision (how often we falsely categorized non-violent events as violent), and recall (the portion of true violent events correctly categorized as violent). For a similar level of accuracy and precision as several other models, the recall rate for logistic regression was about 10 percentage points higher. This is significant because in the context of 911 response, it is especially important not to miss true violent events. Our favored model for prediction had an accuracy rate of 60%, precision of 6%, and recall of 57%. Thus, while we did have many false positives, we correctly categorized a majority of true violent events.
Priority ranking of calls according to the likelihood that they are about a violent crime is probably a more realistic use case for this kind of analysis than binary prediction. After all, 911 responders don’t just want to answer calls about violent crimes: they want to answer as many calls as possible while still making sure that they respond promptly to all reports of violence. For this purpose a ranked list is most useful.
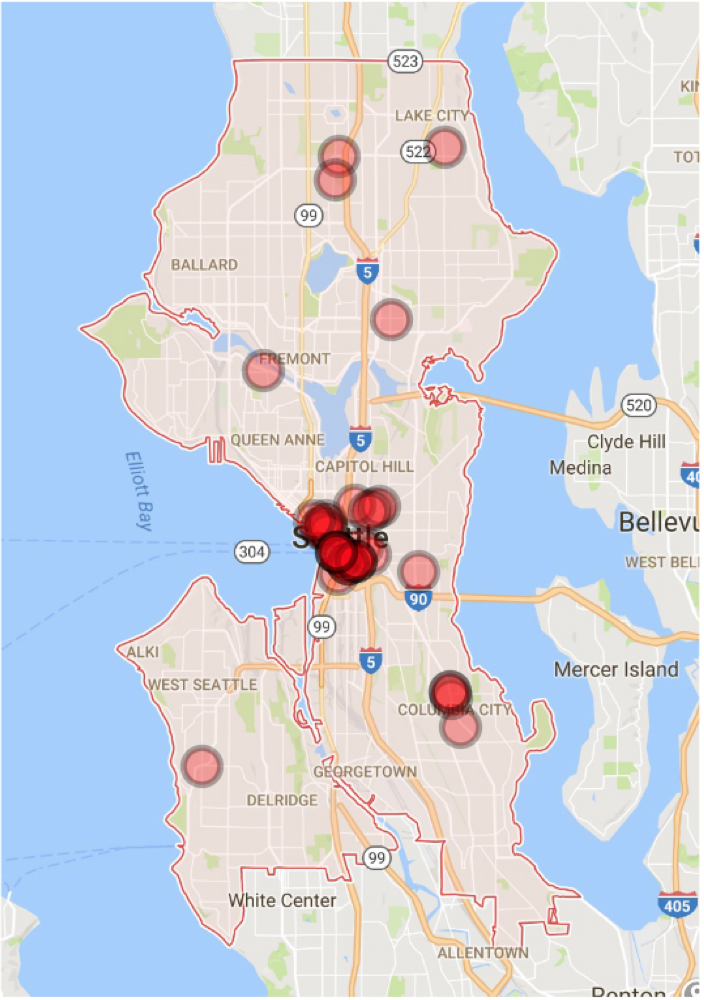
To demonstrate the utility of such a list, we selected all calls from one week, October 26 - November 1, 2015. We ranked these calls in descending order according to the predicted probabilities from our logistic regression model that they involved a violent crime. We then imagined a hypothetical scenario in which the police could only answer half of these calls (presumably unrealistic, but useful for illustration). In practice there were 2,113 calls that week, of which 70 concerned violent crimes. If the police had answered a random sample of half of these calls, they should have been expected to catch about 35 of the true violent events. By comparison, if they had answered the top half of the calls according to our priority ranking, they would have caught 52 of the true violent events. This represents nearly a 50% improvement, as illustrated in the two maps below. The one on the left marks the true violent events captured by a random sample of half the data, while the one on the right marks those captured by a ranked sample of the same size. Because most violent crimes occur in a relatively limited area around the city center, the main difference is the greater concentration of red dots in this area in the righthand map.
 |
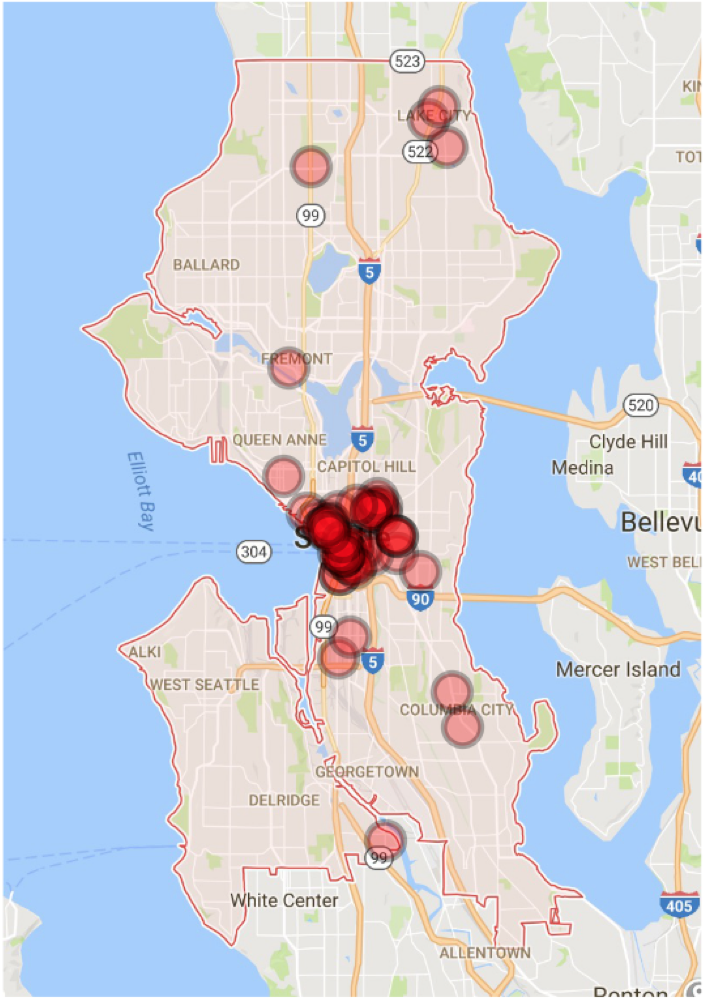 |
| Random sample (35 violent events) | Sorted sample (52 violent events) |
A ranking system of this nature would presumably be more useful the greater the resource constraints a police department faces. For a department that is able to promptly answer all incoming calls and quickly send officers wherever they are needed, it might be of little benefit. Where a department struggles to keep up with the demand for effective law enforcement, however, it could help save many lives. What is more, our investigation offers just one small example of what might be possible. For instance, medical emergencies represent another group of top priority calls for 911 dispatchers, and with additional data we might be able to predict which calls are most likely to require an immediate medical response. Similarly, with more information we might be able to predict which calls are more likely to be false alarms, and rank them lower on a department’s priority list.