With the election coming up in a mere 6 weeks (!), it’s a busy time in politics. One of the perennial challenges for political parties and their candidates is motivating and turning out their own likely voters, those who can be expected to vote for them rather than the competition. In every election cycle, this involves identifying and registering new voters who fit the bill. For the Democrats, young people who haven’t voted before are a major target demographic. If they vote, they are disproportionately likely to vote for Democrats. Yet they are much less likely than older Americans to be registered.
This week I worked with a team to help the NY Democrats find and register young voters in New York City, focusing on college and university students. Because of the 501(c)(3) status of not-for-profit educational institutions, on-campus voter registration efforts must generally be non-partisan. Therefore, we focused on helping the party to locate students as they come and go from campus. Because many students commute to campus via the subway, we recommended that the party deploy voter registration teams outside stations near major campuses throughout the city. We began by identifying the top 15 schools by enrollment, as shown on the map below.
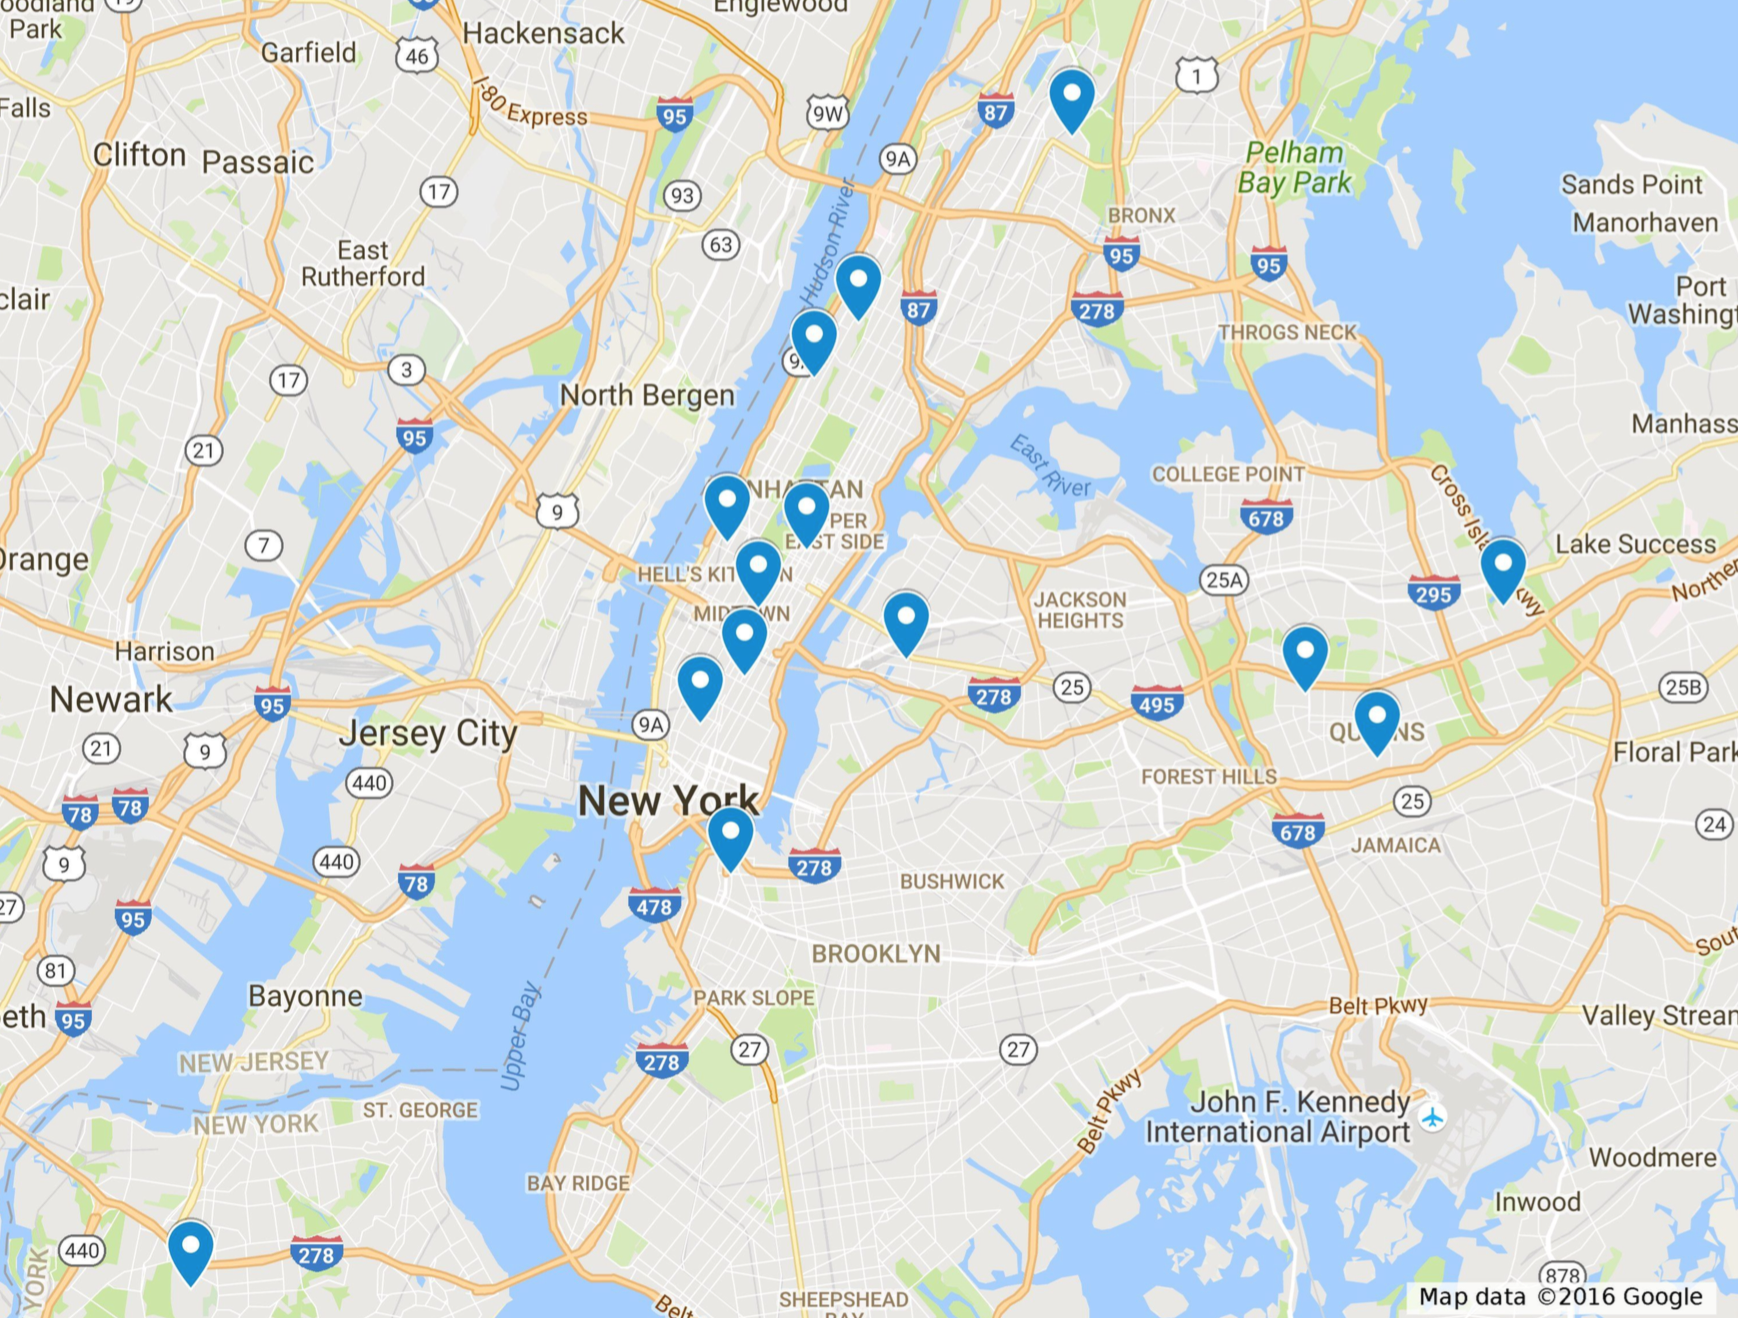
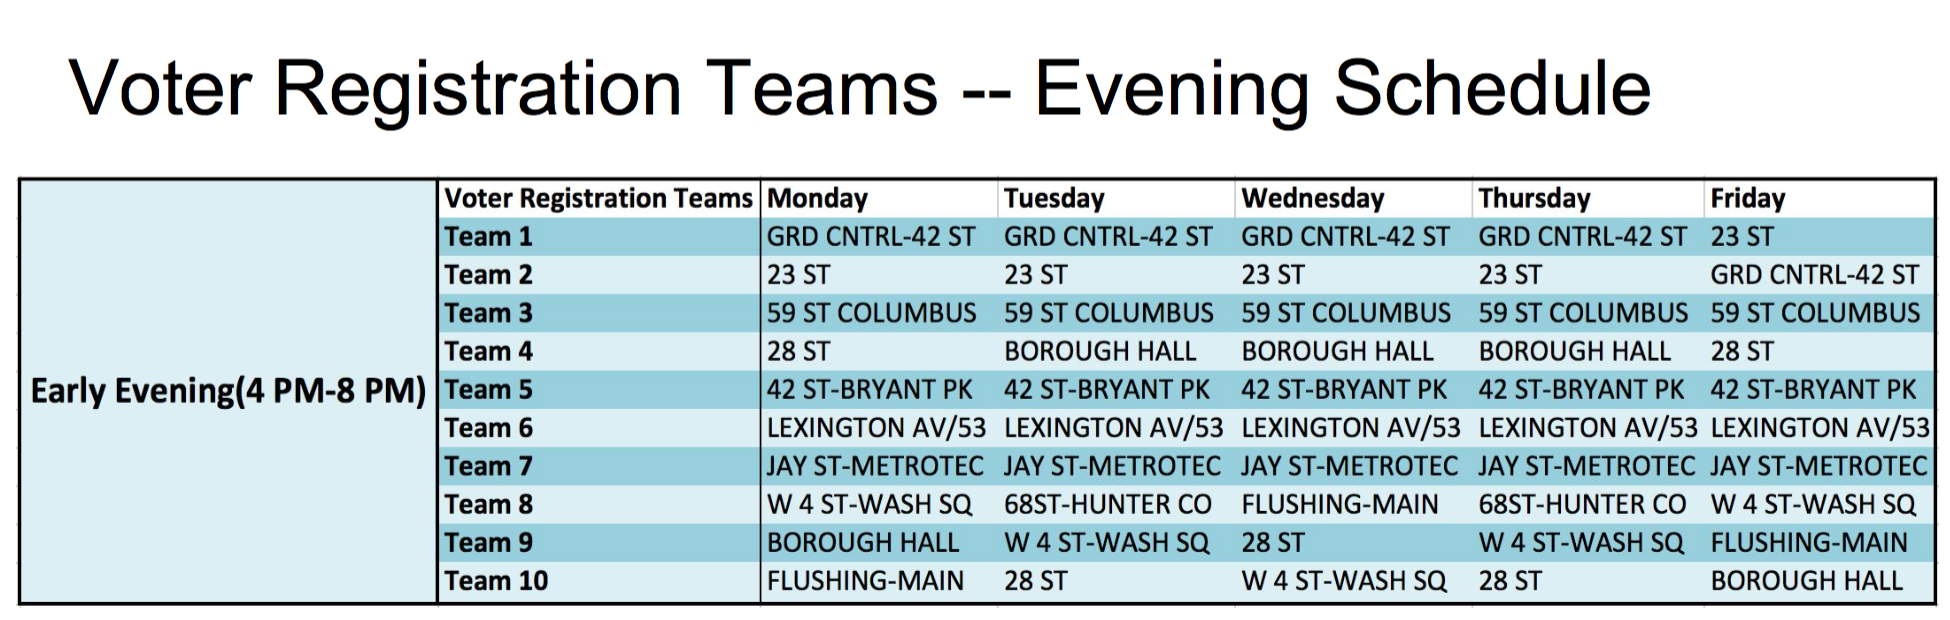
We focused on the three nearest subway stations for each school. This led to a list of about 40 target stations (there was some overlap in stations across schools and one school that was not in walking distance of the subway). With these target stations in mind, we used turnstile data from the MTA for the last four weeks (08/20 – 09/16) to identify when and where the party should send its teams. Our data focused on entries into the subway system, which should capture the volume of people leaving the target stations. Working from two assumptions – that students would be leaving campus in the afternoon and early evening hours, and that the party had ten registration teams to deploy at any given time – our final product was a registration team deployment schedule. The schedule covers ten periods each week: an afternoon and an evening shift for Monday – Friday. The ten stations listed for each time period represent those with the highest average turnstile entry traffic across our four-week period. The final schedule of the stations for the evening shifts (4pm – 8 pm) is shown below.
This graph shows an example of the top stations for one of the time slots (Mondays, 12-4 pm).
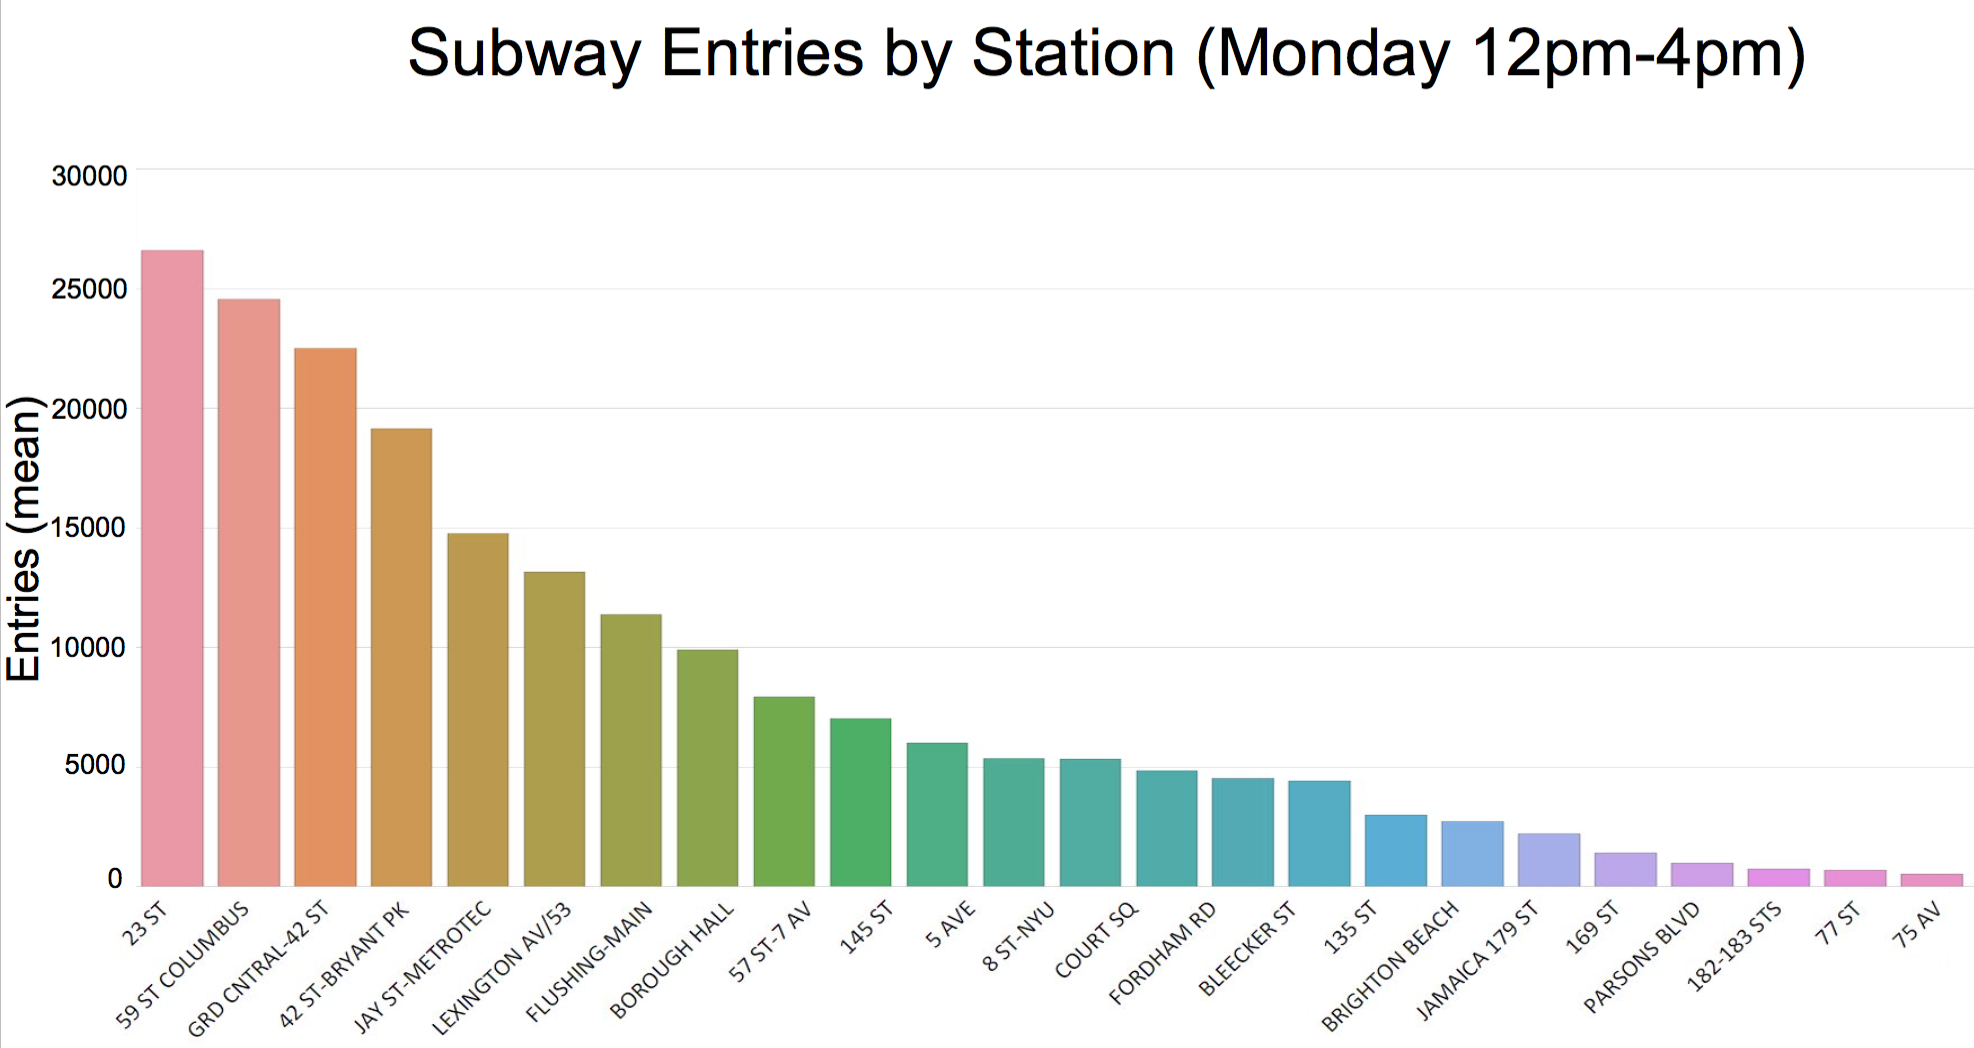
Ideally, we would also have liked to work with the MTA data on turnstile exits, but ended up saving this for the future. Doing so would allow for an analysis of student arrivals to campus, with which we could also create a morning voter registration schedule. In addition, the 12-4 pm period probably sees many students both arriving and departing from campus, and the best data to use there would be the total volume of subway traffic (entries + exits). In keeping with the goal of focusing on registering students, I would also like to weight the stations by the enrollment at the nearby schools. Some of the stations that saw the highest volume of traffic were busy for reasons that don’t have much to do with the proximity of students coming and going to a university nearby (e.g., Grand Central). That doesn’t make them bad places to set up voter registration booths with the goal of targeting young people per se, but it does reflect the reality that identifying and mobilizing new voters is one of the harder problems for political campaigns. Parties and candidates’ campaigns have become very adept at targeting known voters through email lists and other types of contact information. But without this kind of fine-grained data, targeting new voters is a far noisier process.
It struck me during this project that the MTA turnstile data could be used to approach a wide variety of problems, but that for most of them these data alone are likely to offer relatively little purchase. Measuring the volume of foot traffic in specific locations is straightforward, but I suspect there are a pretty limited number of situations in which this would be adequate. Serious questions about the validity of any conclusions to be drawn from this information arise as soon as you want to know anything about the specifics of the rider population. Are they skewed toward students or young people? Are they likely Uber customers? Will people at some locations be more likely to stop and watch a street artist than at other stations? For such questions, you need to combine information on traffic volume with information about the economic and social characteristics of the neighborhoods surrounding the stations.